 Log In
Search




 Open Access
 lipiding_usst@qq.com
Piding Li, Department of Health Sciences and Engineering, University of Shanghai for Science and Technology, No. 334 Jungong Road, Yangpu District, Shanghai 200093, China. E-mail: lipiding_usst@qq.com.
Open Accesslipiding_usst@qq.comPiding Li, Department of Health Sciences and Engineering, University of Shanghai for Science and Technology, No. 334 Jungong Road, Yangpu District, Shanghai 200093, China. E-mail: lipiding_usst@qq.com.
Metal contaminants may be introduced during the pharmaceutical manufacturing process. These contaminants typically originate from various production stages, such as equipment damage, human error, and product packaging. Even with all preventative measures, it is difficult to completely eliminate these metal contaminants [1, 2]. Therefore, integrating metal foreign object detection into the pharmaceutical manufacturing process has become a mandatory procedure. Failure to do so could harm those purchasing the drugs and cause significant economic losses to pharmaceutical companies [3, 4].
Currently, among the metal foreign object detection devices used by many industrial companies, those based on the principle of electromagnetic induction are the most popular type. These metal detectors generate a constantly changing magnetic field. Metal foreign objects within this area generate a secondary magnetic field due to the eddy current effect, which interferes with and cancels out the original magnetic field. By detecting changes in the magnetic field, the presence of metal contaminants can be identified [5, 6]. However, metal detection in pharmaceuticals is often affected by the product itself. When water-containing or electrically saturated pharmaceuticals are placed in an alternating magnetic field, they generate product signals that are similar to those generated by metals. The amplitude of these product signals may mask weak metal signals, making it difficult to detect small metal particles during pharmaceutical metal detection [7]. To address this issue, this study proposes a metal detection method based on time-frequency analysis. This method utilizes a lock-in amplifier circuit to separate the real and imaginary parts of the measurement signal, and then employs a time-frequency analysis algorithm to process and analyze the signal in the time-frequency domain. This enables the detection of minute metal contaminants even under strong product effect interference.
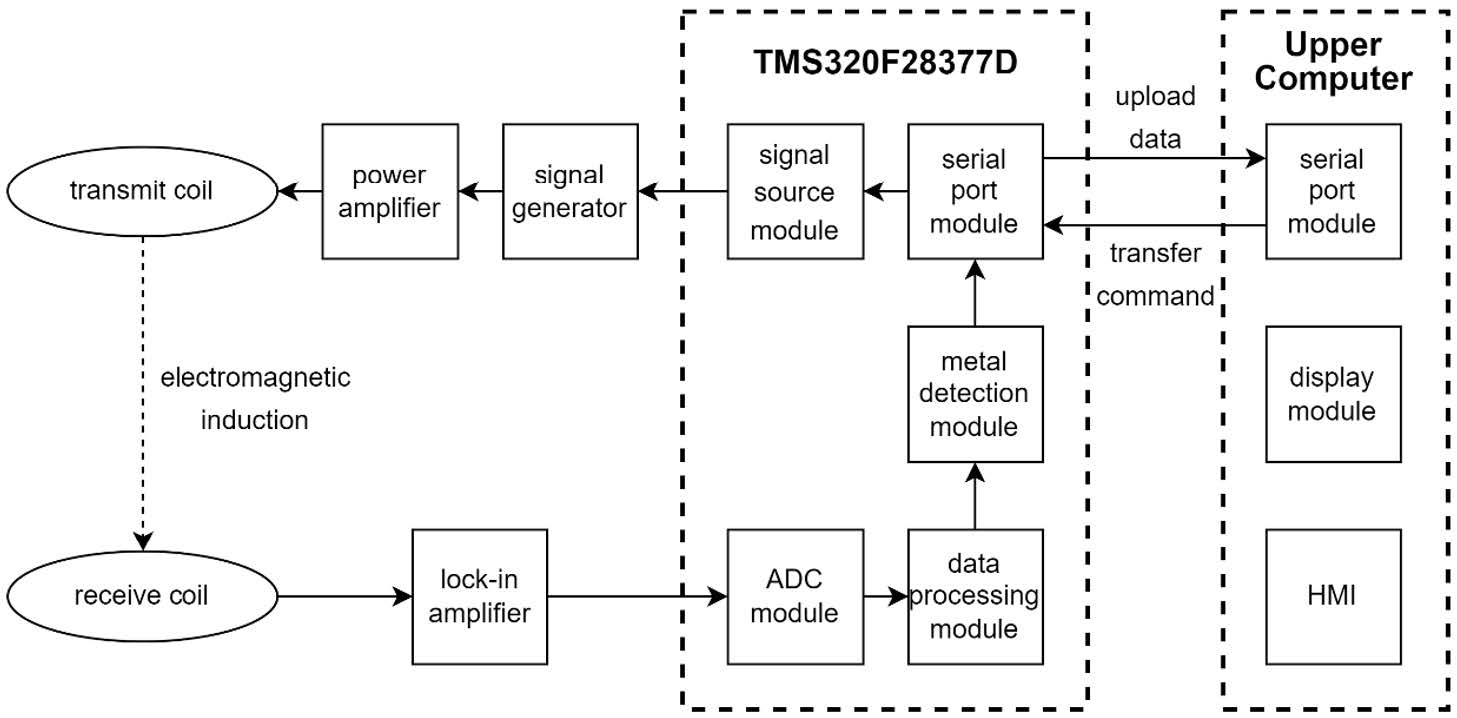
The overall structure of the metal detection system designed in this paper is shown in Figure 1, including a signal generator, a balanced coil sensor, a signal processing circuit, a main control chip TMS320F28377D, and a host computer.

The experimental method is as follows. Firstly, test samples were prepared, using an oral liquid with high product efficacy as the test drug. According to the national standard GB/T 25345-2010, the metal detector must be able to detect ferromagnetic materials with a diameter of 1.2 mm and non-ferromagnetic materials with a diameter of 1.5 mm. Therefore, iron samples with diameters of 1.2 mm, 1.0 mm, and 0.8 mm, and stainless steel and copper metal samples with diameters of 1.5 mm, 1.2 mm, and 1.0 mm were selected for the test. These metal samples were placed under the drug to simulate metal contaminants.
Next, the frequency and amplitude of the excitation signal were set via the host computer. The host computer transmits control commands to the main control chip via serial port. After decoding the commands, the main control chip controls the direct digital synthesizer to output corresponding sinusoidal excitation signals. These signals drive the excitation coil to generate corresponding alternating magnetic fields.
The system first needs to operate under no-load conditions without any samples passing through. Ideally, the balancing coil structure will cancel the induced electromotive force in the two receiving coils, making the system output approximately zero [8]. However, in practice, the two receiving coils of the system cannot be perfectly synchronized and need to be adjusted based on the output signal during no-load operation.
Subsequently, the test sample was allowed to pass through the system, breaking the original magnetic field balance, and the balancing coil will output a detection signal. After the detection signal was quadraturely demodulated by the lock-in amplifier, it would generate an in-phase signal (I) and a quadrature signal (Q). The main control chip synchronously acquires these two signals and uses an algorithm to detect metallic foreign objects. Finally, the detection results are uploaded to the host computer for display via serial communication.
3.1 Signal preprocessing
In metal detection, electromagnetic interference introduces high-frequency noise into the signal, while the effective signal is typically concentrated in the low-frequency range. To suppress high-frequency noise while preserving the waveform characteristics of the effective signal, this study employs a Butterworth low-pass filter for preprocessing the original signal. This filter exhibits maximum flat amplitude characteristics within its passband. The specific design parameters of this filter are shown in Table 1.

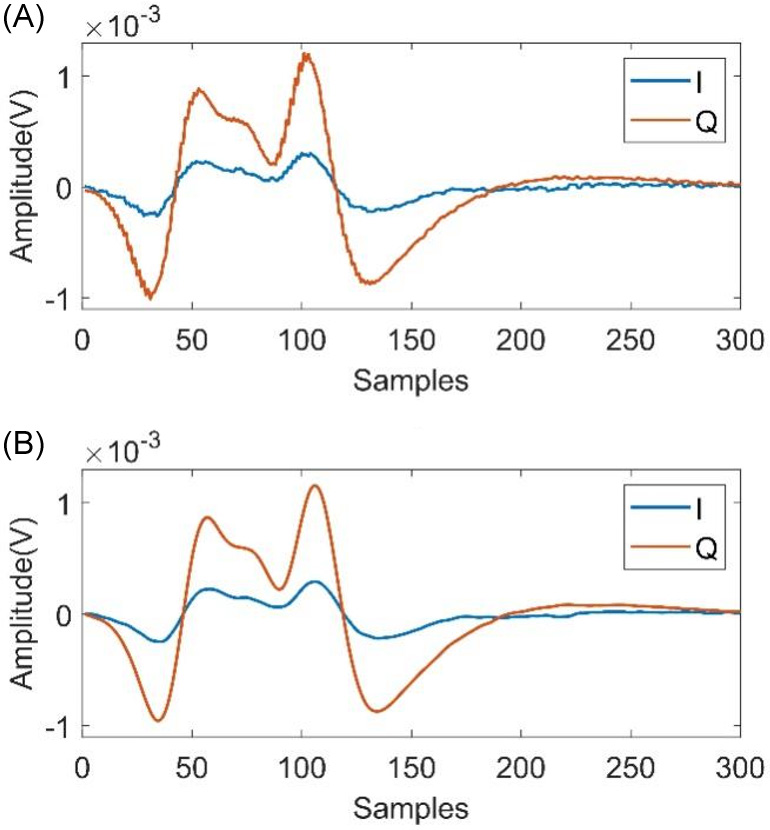
Figure 2. Signal before and after low-pass filter. (A) Raw signal; (B) Filtered signal.
3.2 Phase rotation
In metal detection of pharmaceuticals with high moisture content, interference from the “product effect” is frequently encountered. This means that the product itself generates a signal under the influence of eddy currents, and this product signal is typically much stronger than the metal signal, interfering with metal detection.
Figure 3A shows the IQ component diagrams of metals (iron (Fe), stainless steel (SUS), and brass (Nofe)), and Figure 3B displays the IQ component diagrams of metal-pharmaceutical mixtures. It can be observed that the phases of different metals and pharmaceutical materials differ. However, when a pharmaceutical is mixed with a metal, its phase is very close to that of the individual pharmaceutical material, making direct differentiation difficult. Therefore, this study employs a phase rotation algorithm to suppress interference from product effects by rotating the phase of the detection signal, thereby improving the ability to identify metal signals.
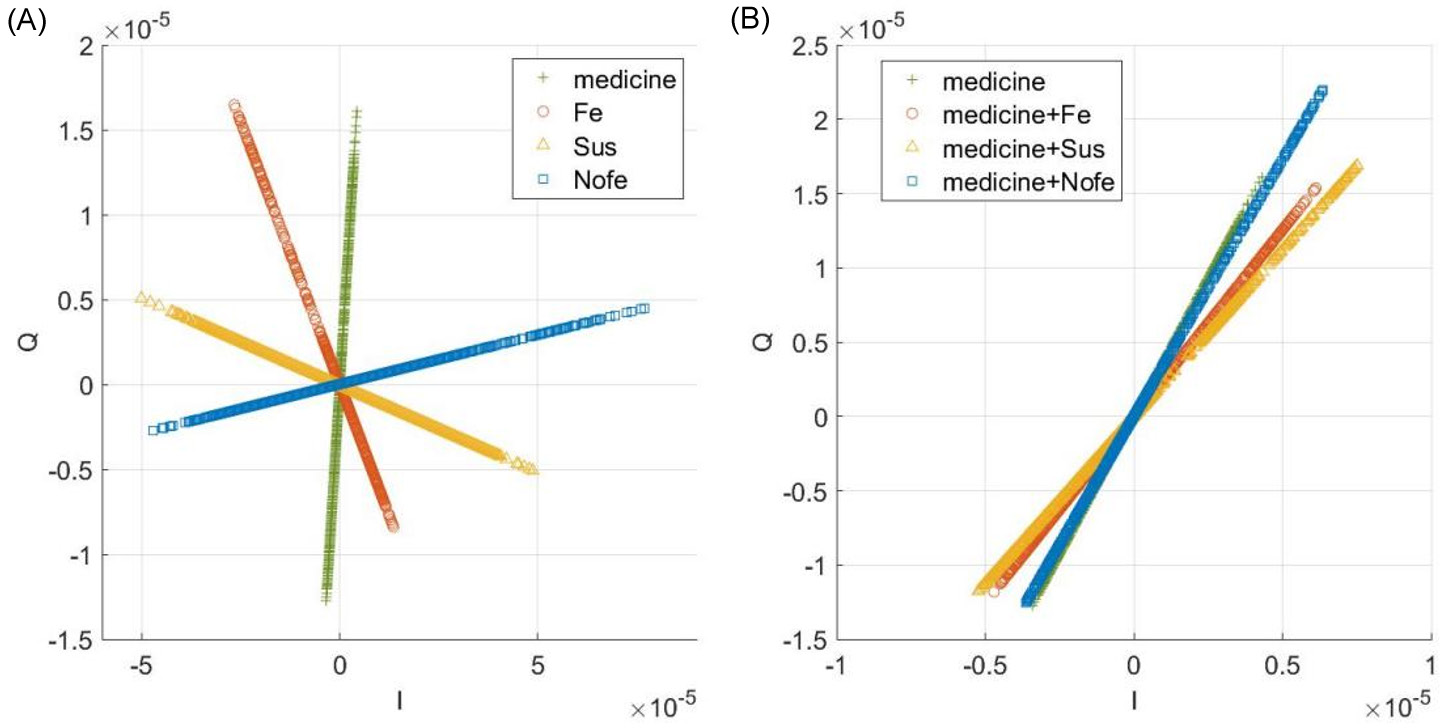
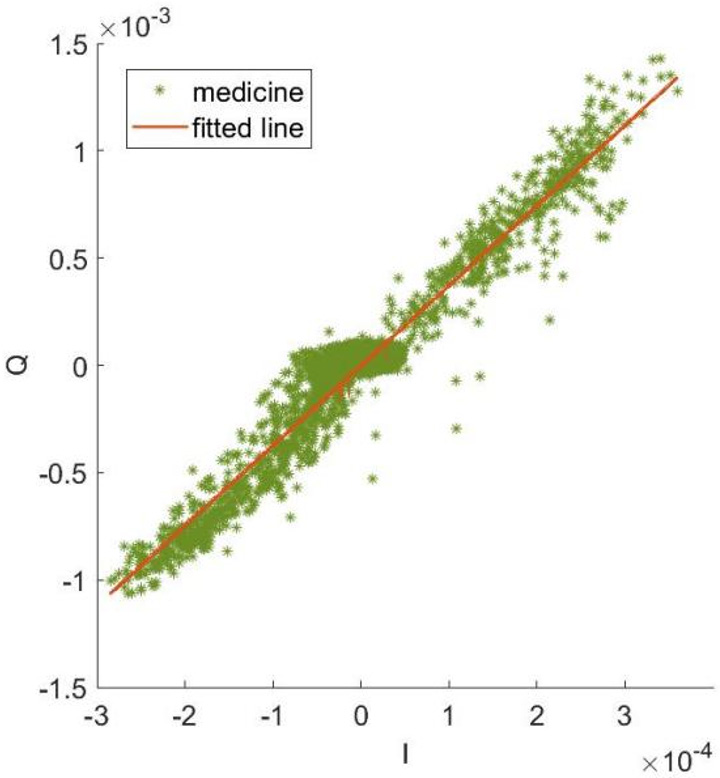
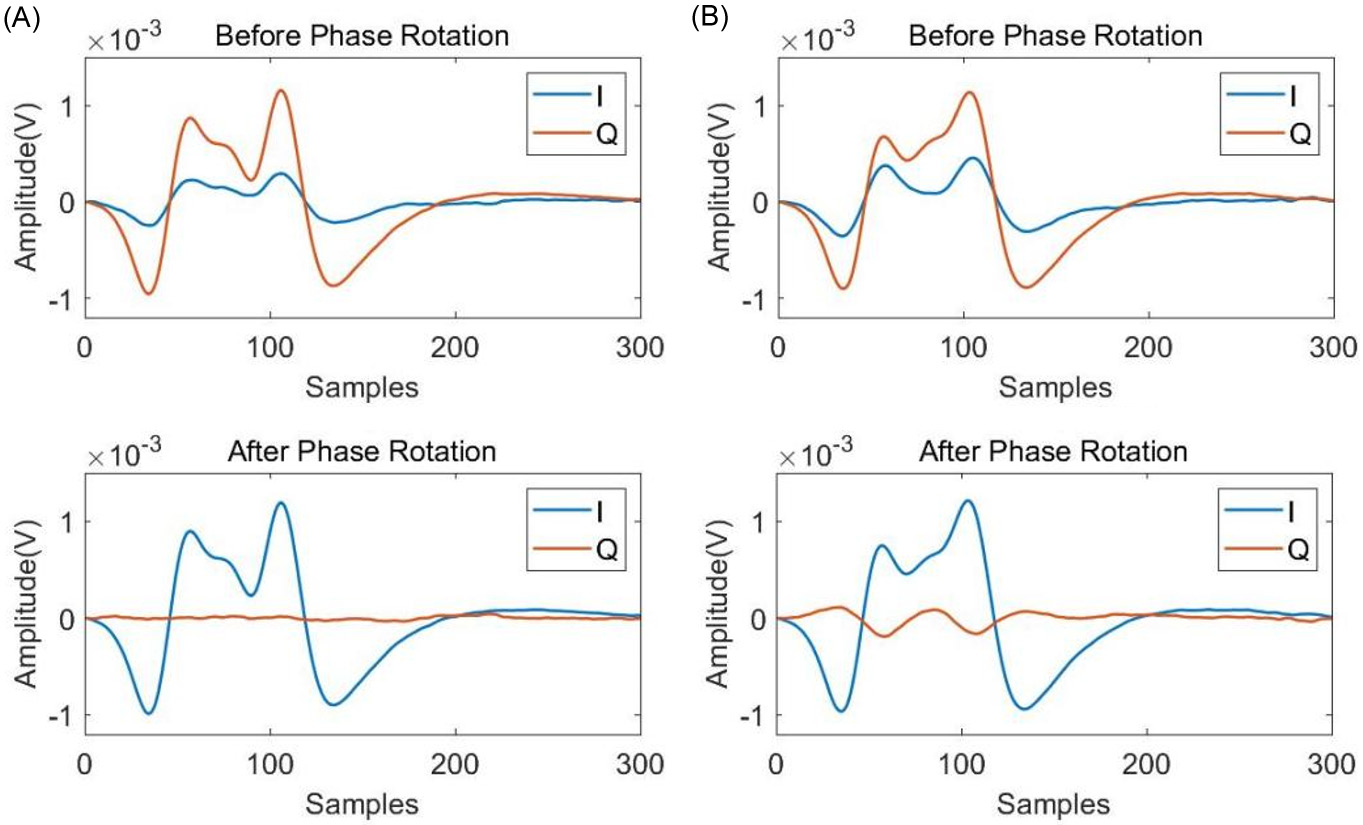
Figure 4 shows the IQ component plot of the pharmaceutical data and the fitted line obtained by the least squares method. Based on this fitted line, the characteristic phase of this type of pharmaceutical can be calculated. Then, this characteristic is used to rotate the detection signal. Figure 5 presents a comparison of the signals before and after phase rotation.
3.3 Time-frequency analysis
Metal detection signals are typical non-stationary signals, with their frequency components changing dynamically over time. Traditional Fourier analysis can only analyze the global frequency domain information of the signal and cannot capture its time-varying spectral characteristics [9, 10]. This study introduces time-frequency analysis techniques, selecting three methods, the Short-Time Fourier Transform (STFT), Wigner-Ville Distribution (WVD), and Smooth Pseudo-Wigner-Ville Distribution (SPWVD)—to process the acquired actual metal detection signals. Through comparative analysis, the method most suitable for the application scenario of this study was selected. The time-frequency representations obtained by the three methods are shown in Figure 6.
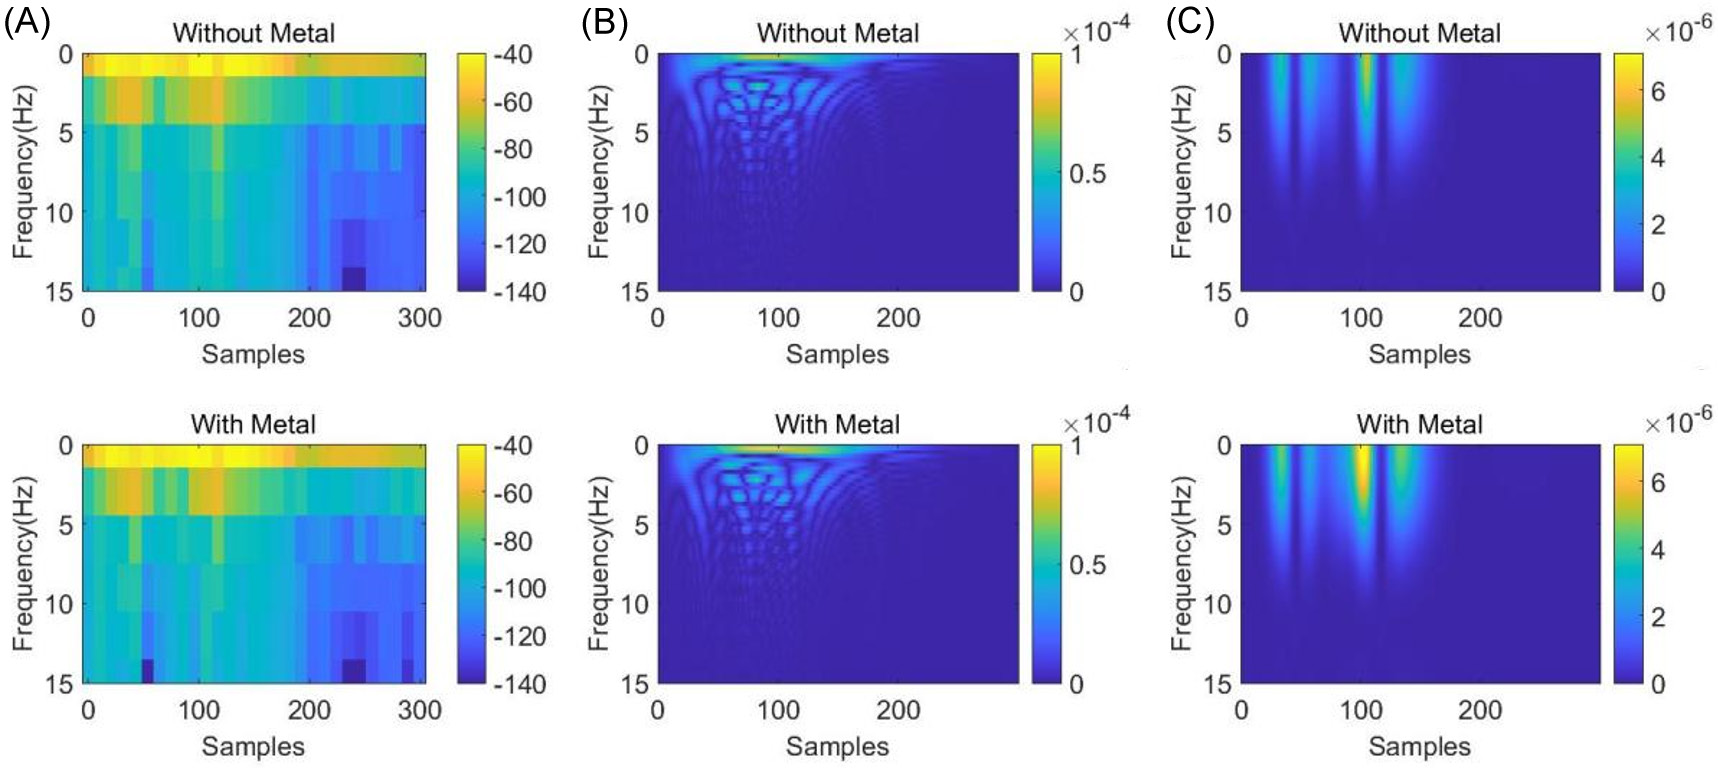
Figure 6. Time-frequency analysis spectrogram. (A) STFT spectrogram; (B) WVD spectrogram; (C) SPWVD spectrogram. STFT, Short-Time Fourier Transform; WVD, Wigner-Ville Distribution; SPWVD, Smoothed Pseudo and Smooth Pseudo-Wigner-Ville Distribution.
STFT uses a sliding technique to divide the signal into windows to obtain the local time-frequency characteristics of the signal [11, 12]. However, this method has limited time-frequency resolution, making it difficult to meet the high-precision analysis requirements for transient and steady-state features [13]. As shown in Figure 6A, although the background of the STFT time-frequency representation is clean, its time-frequency resolution is the lowest, and the energy distribution is relatively dispersed, which is not conducive to the accurate extraction of subsequent subtle features.
WVD exhibits the best time-frequency clustering, but when the signal contains multiple frequency components, there will be spurious responses between these components without physical meaning, leading to severe cross-term interference [14-16]. As shown in Figure 6B, WVD time-frequency representation achieves the highest energy concentration, yet the severe cross-term interference complicates the interpretation of genuine signal components, posing a significant challenge to subsequent classification tasks.
SPWVD, based on WVD, applies window functions for smoothing in both time and frequency dimensions [17, 18]. As shown in Figure 6C, SPWVD time-frequency representation achieves the best balance between time-frequency concentration and cross-term suppression. It inherits the energy concentration advantage of WVD while filtering out most cross-terms through a smoothing window, ultimately yielding a clear and accurate time-frequency representation [19].
Practical testing has proven that SPWVD is the most suitable method for analyzing non-stationary signals such as metal detection signals. Therefore, this study adopts SPWVD as the core algorithm for time-frequency analysis.
3.4 Metal discrimination algorithm
Product signals containing metal foreign objects (positive samples) and product signals without metal foreign objects (negative samples) exhibit stable and quantifiable response differences in the time-frequency domain. Based on this phenomenon, this study proposes a metal detection algorithm based on a time-frequency difference template. The metal detection algorithm consists of two parts: “region learning” and “classification and recognition”. The algorithm flow is shown in Figure 7. In the “region learning” stage, five sets of positive samples and five sets of negative samples are collected respectively. The average time-frequency maps of the positive and negative samples are used to obtain the significantly different regions that highlight the metal features. In the “classification and recognition” stage, the response values of the test sample’s time-frequency map and the average time-frequency map of the negative samples in the significantly different regions are compared, and then compared with a preset threshold to complete the classification judgment, thereby realizing the detection of metal foreign objects.
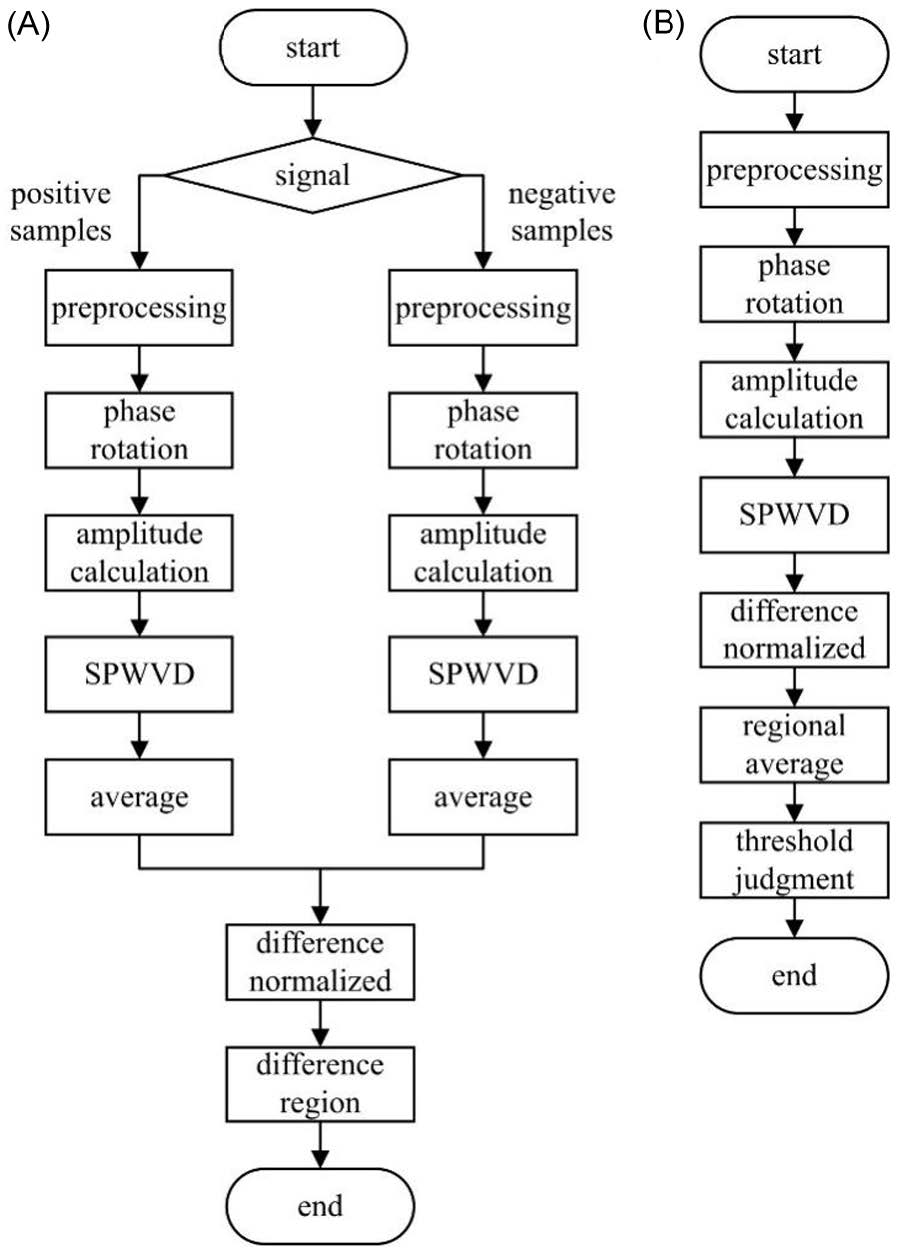
Figure 7. Metal discrimination flowchart. (A) Region learning; (B) Classification recognition.
The main control chip used in this system is the Texas Instruments TMS320F28377D microcontroller. This microcontroller integrates two CPUs with a clock frequency of 200 MHz and two programmable law accelerators (CLAs), which can perform computational tasks independently of the CPUs. Signal acquisition, data processing, and metal detection algorithms are all implemented on this microcontroller.
To optimize the system’s detection performance, this study conducted actual tests on the computation time consumption of each module of the algorithm. The test results are shown in Table 2.

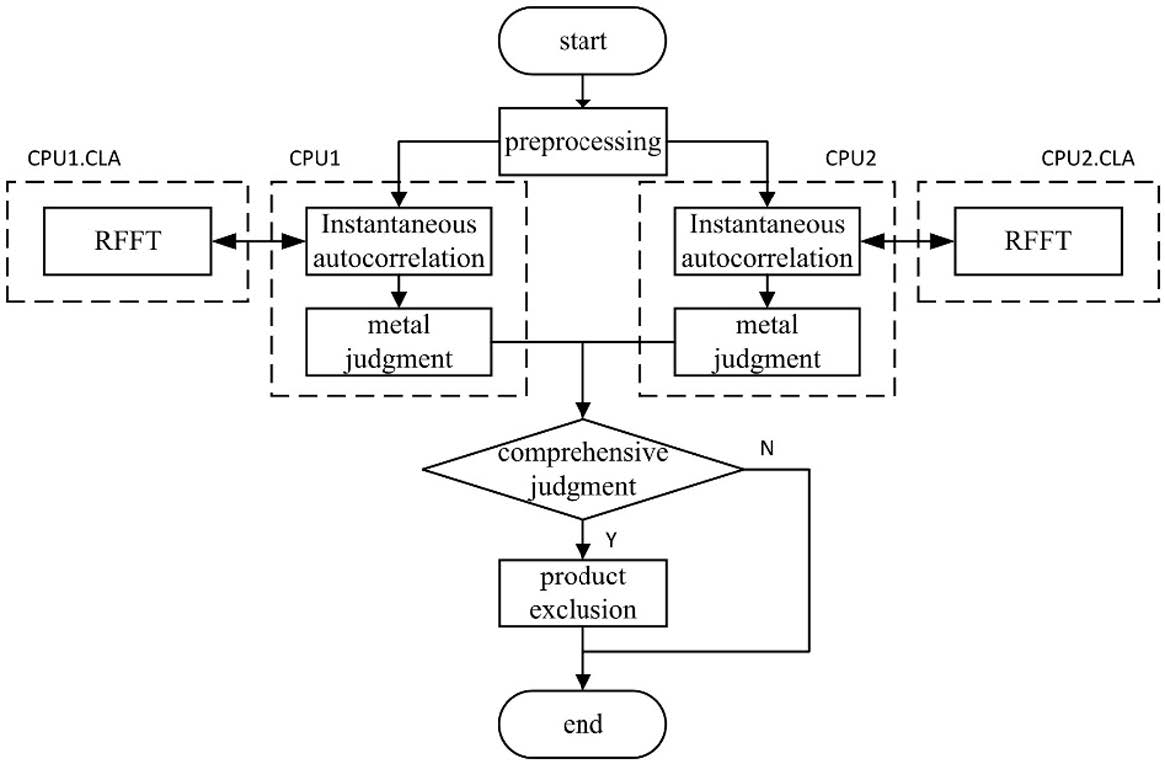
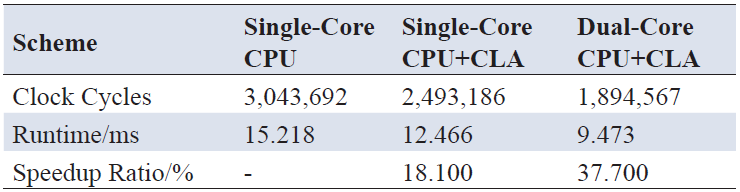
The test results indicate that the multiple real fast Fourier transforms (RFFTs) in the SPWVD algorithm are the most time-consuming part of the entire process. From the algorithm principle, the SPWVD calculation can be divided into two main steps: instantaneous autocorrelation and RFFT. Since multiple sets of instantaneous autocorrelation data are independent of each other, their RFFT calculations can be processed in parallel. Therefore, this study proposes a hardware acceleration scheme for the algorithm based on a dual-core CPU and CLA. The overall block diagram of this scheme is shown in Figure 8. A single set of detection data will be divided into two parts, which will be processed jointly by CPU1 and CPU2. The most time-consuming RFFT calculation task will be offloaded to the CLA for execution [20]. While the CLA is executing the RFFT calculation task for the current data block, the CPU can simultaneously execute the instantaneous autocorrelation calculation task for the next data block, thereby improving computational efficiency. Finally, CPU1 synthesizes the metal discrimination results to determine whether there is a metal foreign object.
The parallel processing scheme based on dual-core CPU and CLA involves data communication between the dual-core CPUs and between the CPU and the CLA. To ensure effective and coordinated data transmission, this paper proposes a data exchange and management scheme. CPU1 and CPU2 achieve data access synchronization through IPC, and achieve efficient data transmission between the dual-core CPUs using Global Shared RAM (GSRAM). The CPU and CLA achieve data access synchronization through Task Driver Management. This mechanism differs from the traditional interrupt-driven mode, does not involve interrupt overhead, and can achieve efficient data transmission between the CPU and the CLA through Local Shared RAM (LSRAM).
To test the performance of the optimization scheme, this study measured the running time of the detection algorithm under three different implementation methods through actual testing. The test results are shown in Table 3 below. Test results show that compared to a single-core CPU solution, the combination of a single-core CPU and CLA reduces computation time by approximately 18.1%. Meanwhile, the dual-core CPU and CLA processing solution reduces time by approximately 37.7% compared to the single-core CPU solution. The dual-core CPU and CLA acceleration algorithm improve the system’s real-time processing performance, and the reduced detection time allows for further increases in production line transmission speed, thereby improving production line efficiency.
Table 3. Performance comparison of different implementation schemes
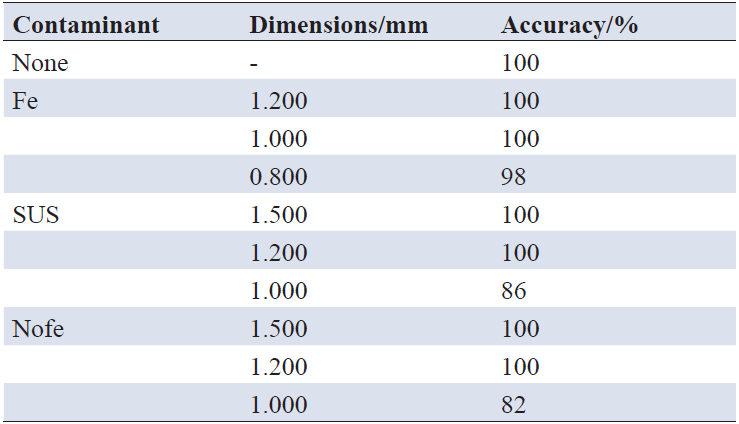
This study selected an oral liquid with a strong product effect as the test product to verify the detection system’s ability to detect different metals. The metal foreign objects used for testing were standard test sample cards placed inside plastic cards, containing three types of particles: iron, stainless steel, and brass. The test sample set consisted of positive samples containing some metal contaminants and negative samples without metals. Each sample was tested 50 times in the detection system, and the relevant statistical data are shown in Table 4.
Author contributions
Lin Jiang is responsible for software development, data analysis, and writing the original draft, Piding Li provides supervision and participates in the review and editing of the manuscript.
Funding
This research received no external funding.
Data availability
Not applicable.
Ethics approval and consent to participate
Not applicable.
Consent for publication
All authors have reviewed the final version of the manuscript and have given their consent for publication.
Competing interests
The authors declare that they have no competing interests.
Acknowledgements
Not applicable.
[1] Poonam K. Metallic impurities in pharmaceuticals: An overview. Curr Pharm Anal. 2021;17(8):960-968. http://dx.doi.org/10.2174/1573412916999200711151147
[2] Balaram V. Recent advances in the determination of elemental impurities in pharmaceuticals - Status, challenges and moving frontiers. Trends Anal Chem. 2016 Jun 1;80:83-95. https://doi.org/10.1016/j.trac.2016.02.001
[3] Abernethy DR, DeStefano AJ, Cecil TL, Zaidi K, Williams RL; USP Metal Impurities Advisory Panel. Metal impurities in food and drugs. Pharm Res. 2010 May 1;27(5):750-755. https://doi.org/10.1007/s11095-010-0080-3
[4] Aleluia ACM, Nascimento MdS, dos Santos AMP, dos Santos WNL, de Freitas Santos Junior A, Ferreira SLC. Analytical approach of elemental impurities in pharmaceutical products: A worldwide review. Spectrochim Acta B. 2023 Jul 1;205:106689. https://doi.org/10.1016/j.sab.2023.106689
[5] Shi H, Xie Y, Zhang H, Li W, Ma L, Xu Z, et al. An ultrasensitive debris microsensor for oil health monitoring based on resistance-inductance parameter. IEEE Trans Instrum Meas. 2021 August 30;70:1-9. https://doi.org/10.1109/TIM.2021.3105255
[6] Xie Y, Shi H, Zhang H. Mixed metal differentiation method using microfluidic oil detection sensors. J Phys Conf Ser. 2024 Apr 1;2740:012014. https://doi.org/10.1088/1742-6596/2740/1/012014
[7] Haimovich H, Marelli D, Sarlinga D. A signal processing method for metal detection sensitivity improvement in balance-coil metal detectors for food products. 2020 IEEE International Conference on Industrial Technology (ICIT); 2020 Feb 26-28; Buenos Aires (Argentina). Piscataway (NJ): IEEE; 2020. p. 645-651. https://doi.org/10.1109/ICIT45562.2020.9067312
[8] Okabe S, Sasada I. Development of a planar-type high sensitivity metallic contaminant detector. Aip Advances. 2017 May;7(5):7. https://doi.org/10.1063/1.4978590
[9] Wang Y, Ji S, Xu H. Non-stationary signals processing based on STFT. 2007 8th International Conference on Electronic Measurement and Instruments; 2007 Aug 16-18; Xi'an (China). Piscataway (NJ): IEEE; 2007. p. 3-301-3-304. https://doi.org/10.1109/ICEMI.2007.4350914
[10] Liu W, Ma Z, Sun H. Summary of weak signal detection and processing methods. Proceedings of the 2018 International Conference on Mechanical, Electronic, Control and Automation Engineering (MECAE 2018); 2018 Mar 30-31; Qingdao (China). Atlantis Press; 2018. p. 213-216. https://doi.org/10.2991/mecae-18.2018.40
[11] Beuter C, Oleskovicz M. S-transform: from main concepts to some power quality applications. IET Signal Process. 2020 May 1;14(3):115-123. https://doi.org/10.1049/iet-spr.2019.0042
[12] Li M, Liu Y, Wang T, Chu F, Peng Z. Adaptive synchronous demodulation transform with application to analyzing multicomponent signals for machinery fault diagnostics. Mech Syst Sig Process. 2023 May 15;191:110208. https://doi.org/10.1016/j.ymssp.2023.110208
[13] Wang X, Ying T, Tian W. Spectrum representation based on STFT. 2020 13th International Congress on Image and Signal Processing, BioMedical Engineering and Informatics (CISP-BMEI); 2020 Oct 17-19; Chengdu (China). Piscataway (NJ): IEEE; 2020. p. 435-438. https://doi.org/10.1109/CISP-BMEI51763.2020.9263516
[14] Alsalmi H, Wang Y. Mask filtering to the Wigner-Ville distribution. Geophysics. 2021 Sep 30;86(6):V489-V496. https://doi.org/10.1190/geo2021-0193.1
[15] Zhu Q, Wang Y, Shen G. Comparison and application of time-frequency analysis methods for nonstationary signal processing. In: Lin S, Huang X, Lin S, Huang XS, editors. Advanced Research on Computer Education, Simulation and Modeling (CESM 2011); 2011; Berlin, Heidelberg. Berlin: Springer Berlin Heidelberg; 2011. p. 286-291. https://doi.org/10.1007/978-3-642-21783-8_47
[16] Bin G, Liao CJ, Li X. The method of fault feature extraction from acoustic emission signals using Wigner-Ville distribution. Adv Mater Res. 2011 Mar 15;216:732-737. https://doi.org/10.4028/www.scientific.net/AMR.216.732
[17] Pan Z, Li C, Zhou X, Deng F, Li T. Combined SPWVD and WVD for high-resolution time-frequency analysis of fault traveling waves. 2025 IEEE 8th International Electrical and Energy Conference (CIEEE); 2025 May 16-18; Changsha (China). Piscataway (NJ): IEEE; 2025. p. 3575-3580. https://doi.org/10.1109/CIEEC64805.2025.11116203
[18] Kalra M, Kumar S, Das B. Target detection using smooth pseudo Wigner-Ville distribution. 2018 IEEE Recent Advances in Intelligent Computational Systems (RAICS); 2018 Dec 6-8; Thiruvananthapuram (India). Piscataway (NJ): IEEE; 2018. p. 6-10. https://doi.org/10.1109/RAICS.2018.8635078
[19] Cao M, Sun Z, Gong E, Xie H. Features extraction of pulse acoustic based on SPWVD. 2017 International Conference on Sensing, Diagnostics, Prognostics, and Control (SDPC); 2017 Aug 16-18; Shanghai. Piscataway (NJ): IEEE; 2017. p. 538-542. https://doi.org/10.1109/SDPC.2017.108
[20] Zhao S, Zhang X, Sun S, Wang X. Research on control law accelerator of digital signal process chip TMS320F28035 for real-time data acquisition and processing. Phys Conf Ser. 2017 Aug 1;887(1):012092. https://doi.org/10.1088/1742-6596/887/1/012092
[21] Bai S, Bai Y. High precision algorithm of metal detector based on balance coil. 2018 21st International Conference on Electrical Machines and Systems (ICEMS); 2018 Oct 7-10; 2018. p. 684-687. https://doi.org/10.23919/ICEMS.2018.8549203
ISSN: 2957-5478
Volume 4, Issue 1
March 2026
Pages: 1-76


 Log In

 On This Page
 CITE
CITE