 Log In
Search




 Open Access
 guoxd@usst.edu.cn
This review systematically summarizes the research progress of artificial intelligence technologies in the diagnosis of cardiac hypertrophy based on cardiac MRI, with a focus on AI diagnostic methods utilizing Cine-MRI, T1/T2 Mapping, late gadolinium enhancement (LGE), and multi-sequence fusion strategies.
This review highlights the application potential and current limitations of natural language processing-based automated MRI report parsing technology for large-scale case screening and phenotypic stratification.
This review analyzes existing challenges in AI diagnosis, including data quality, annotation consistency, and model generalization, and discusses future directions such as multicenter collaboration, multimodal data fusion, and clinical translation.
Open Accessguoxd@usst.edu.cnThis review systematically summarizes the research progress of artificial intelligence technologies in the diagnosis of cardiac hypertrophy based on cardiac MRI, with a focus on AI diagnostic methods utilizing Cine-MRI, T1/T2 Mapping, late gadolinium enhancement (LGE), and multi-sequence fusion strategies.
This review highlights the application potential and current limitations of natural language processing-based automated MRI report parsing technology for large-scale case screening and phenotypic stratification.
This review analyzes existing challenges in AI diagnosis, including data quality, annotation consistency, and model generalization, and discusses future directions such as multicenter collaboration, multimodal data fusion, and clinical translation.
Cardiac hypertrophy is a pathological condition characterized by abnormal thickening of the ventricular wall, typically manifested as a significant increase in left ventricular (LV) wall thickness. The etiologies of cardiac hypertrophy are diverse and may arise from both physiological and pathological mechanisms, including athletic cardiac remodeling, hypertensive heart disease (HHD), aortic stenosis (AS), hypertrophic cardiomyopathy (HCM), infiltrative cardiomyopathies, and various storage or metabolic disorders such as cardiac amyloidosis (CA) and Anderson–Fabry disease (AFD) [1]. Cardiac hypertrophy is associated with increased risk of heart failure, arrhythmia, cardiovascular mortality, and sudden cardiac death. Early recognition and accurate determination of the underlying etiology can substantially improve clinical outcomes, particularly in patients under 60 years of age [2]. However, the wide spectrum of causes, clinical manifestations, and disease progression make accurate diagnosis and risk stratification a persistent clinical challenge.
Imaging plays a central role in the diagnostic workflow of cardiac hypertrophy. Conventional echocardiography is broadly accessible but is operator-dependent and provides limited quantification of myocardial tissue characteristics. Cardiac computed tomography (CT) provides excellent anatomical visualization but involves ionizing radiation and lacks dynamic functional assessment. In contrast, cardiac magnetic resonance (CMR) provides superior soft tissue resolution, precise and highly reproducible measurements (including myocardial wall thickness, chamber size, hypertrophy patterns, and systolic function), and multiparametric imaging capabilities, such as T1 mapping anPlr3 ladolinium enhancement (LGE). These advantages have established CMR as the “gold standard” for assessing the etiology of cardiac hypertrophy, the degree of fibrosis, and functional impairment, making it the most valuable imaging modality for evaluating LV hypertrophy [3].
With the growing demand for cardiac imaging and the continuous advancement of technology, CMR analysis faces several challenges associated with image acquisition, data quality, annotation, and concerns regarding patient privacy, data sharing, and institutional standardization. Moreover, conventional analysis methods often struggle to accommodate patients with complex or atypical pathological conditions [4]. Against this background, the rapid development of AI-based medical imaging analysis presents a promising solution that provides new approaches for improving the accuracy, standardization, and efficiency of cardiac MRI interpretation [5].
Although significant advances has been made in AI-assisted diagnosis of cardiac hypertrophy, existing studies are fragmented and rarely provide a comprehensive overview focused on CMR, the “gold standard” imaging modality. Therefore, this review systematically examines the research progress of CMR-based AI technologies in diagnosing cardiac hypertrophy and explores the current challenges and future directions of AI in intelligent diagnostic support for cardiac hypertrophy disease.
2.1 AI Diagnosis of cardiac hypertrophy based on cine-MRI
Cine-CMR acquires continuous dynamic images throughout the cardiac cycle using the steady-state free precession (SSFP) sequence, which enables detailed observation of morphological changes of heart with high temporal and spatial resolution. Cine-CMR has become the gold standard for cardiac structural and functional assessment. For the diagnosis of cardiac hypertrophy diseases, Cine-MRI can precisely identify the location, extent, and pattern of ventricular wall thickening, distinguish physiological from pathological hypertrophy, differentiate myocardial lesions caused by different etiologies, and assess the hemodynamic impact of the disease through cardiac function parameters, providing critical information for clinical decision-making.
2.1.1 Detection and identification of cardiac hypertrophy
In deep learning applications, Budai et al. developed an ensemble model based on 3D ResNet for automated detection of left ventricular hypertrophy (LVH) in CMR [6]. The study involved 428 LVH patients and 234 healthy controls. The ensemble model simultaneously processed short-axis and long-axis cardiac images, yielding highly precise binary classification between LVH and normal hearts, with a recall rate of 97%, demonstrating exceptional ability in identifying suspected cases. A key innovation was the introduction of image normalization through long-axis superimposition to mitigate directional noise, significantly enhancing model performance.
To address the limitation of traditional single-frame or single-branch deep learning models in adequately capturing cardiac dynamic features, You et al. proposed an innovative solution based on a dual-branch neural network integrating static morphology and dynamic motion information [7]. The architecture combined static and dynamic features and innovatively introduced a multi-task learning mechanism, where the primary task performed cardiomyopathy classification and the auxiliary task quantified cardiac motion amplitude by comparing standard deviations of images at identical positions in static and dynamic branches. On a dataset containing 78 training sequences and 26 test sequences, this method achieved 96.79% accuracy and 95.24% sensitivity for binary classification of hypertrophic obstructive cardiomyopathy (HOCM) versus normal hearts, representing improvements of 10.11% and 12.02% over ResNet50 and DenseNet, respectively. More importantly, the loss curve basically converged after 100 epochs, and the training efficiency was approximately twice that of the traditional single-branch network.
Ma et al. further explored the potential application of radiomics for early HHD diagnosis, enrolling 132 patients [8]. A total of 1,521 radiomics features were extracted from the end-diastolic (ED) and end-systolic (ES) phases of cine sequences, and three-class classification models were built using machine learning (ML) algorithms such as random forest, support vector machine (SVM), and naive Bayes. The SVM model based on the ED-ES feature subset achieved the highest accuracy (83.3%), with a macro-AUC of 0.941, and the AUCs for HHD, hypertension with normal cardiac structure and function (HWN), and healthy subjects were 0.967, 0.876, and 0.963, respectively.
In addition to the morphological classification models, automatic analyses of cardiac strain parameters have shown unique diagnostic value. Abràmoff et al. used commercial AI software (SuiteHEART) for fully automated LV global longitudinal strain (GLS) analysis in 111 CMR examinations (70 AS, 41 healthy controls) [9]. The results showed that the AI-driven CMR GLS measurements were strongly associated with echocardiographic GLS and exhibited smaller standard deviations, indicating higher accuracy and reproducibility.
2.1.2 Differentiation of cardiac hypertrophy phenotype from other cardiomyopathies
Studies in this domain employ multi-class classification frameworks to position cardiac hypertrophy within the broader spectrum of cardiomyopathies, utilizing both traditional radiomics-based machine learning (ML) and deep learning approaches to achieve phenotypic differentiation. Zhang et al. analyzed 283 patients from two public databases (ACDC and M&Ms) to establish a multi-classification model based on radiomics features [10]. The research team extracted 21 feature subsets from ED-ES images of the LV, right ventricle, and myocardium, testing nine ML algorithms, including random forest, SVM, and logistic regression. Among 90 model combinations, the random forest model using the minimum redundancy maximum relevance (mRMR) feature selection achieved optimal performance, with a three-class classification accuracy of 91.2% and a macro-average AUC of 0.947. Class-specific AUCs were 0.938, 0.966, and 0.936 for healthy controls, dilated cardiomyopathy (DCM), and HCM, respectively. Five-fold cross-validation demonstrated an average accuracy of 83.0%, sensitivity of 80.4%, and specificity of 90.6%.
The development of deep learning technologies has enabled end-to-end analysis of Cine-MRI images, automatically learning hierarchical representations and mapping raw images to diagnostic outcomes. Germain et al. retrospectively analyzed 534 patients (209 normal, 175 HCM, 150 DCM) to evaluate the performance of several pre-trained convolutional neural networks (CNNs) for cardiomyopathy classification [11]. Transfer learning strategies employed VGG16, ResNet50V2, InceptionResNetV2, and DenseNet201 pre-trained on ImageNet as backbone networks, with final layers fine-tuned to adapt to cardiac imaging. The result shows that the dual-input VGG model achieved 98.2% accuracy in six-fold cross-validation, substantially higher than the accuracy of single-frame input model. Grad-CAM heatmap analysis revealed that over half of misclassifications were due to the network focusing on extracardiac structures rather than the LV region, indicating that cardiac region segmentation preprocessing could improve model robustness.
Guo et al. systematically evaluated the performance of commercial AI software in quantitative LV function analysis in 388 patients (123 HCM, 130 DCM, 135 healthy controls) [12]. AI-based automatic analysis performed best in HCM patients, with correlations exceeding 0.901 between all four LV function parameters and manual measurements, while performance significantly declined in DCM patients, with the correlation coefficients for ejection fraction (EF) and stroke volume (SV) dropping to 0.776 and 0.645, respectively. Receiver operating characteristic (ROC) curve analysis indicated that, at optimal cut-off values, AI-derived EF parameters identified DCM patients with 92.31% sensitivity and 82.96% specificity, whereas HCM identification showed 78.05% sensitivity and 54.07% specificity, suggesting that LV volume parameters are more informative in DCM diagnosis, whereas EF is more suitable for HCM differentiation.
In small sample learning scenarios, few-shot learning (FSL) provides an innovative solution for alleviating the data scarcity problem in medical imaging. Wibowo et al. proposed a two-stage approach combining segmentation and few-shot classification using the MICCAI 2017 ACDC dataset [13]. A “2D Thickness Algorithm” was designed to convert multi-layer short-axis slices from U-Net segmentation outputs into compact 2D representations, directly extracting morphological information from segmentation results. The EfficientNetB5-UNet segmentation model achieved LV Dice Score of 96.24% ED and 89.92% ES, and the integrated few-shot classifier reached 92% accuracy on the test set, which is comparable to the traditional random forest models based on derived features. This study demonstrated the feasibility of constructing disease-specific representations from segmentation outputs, providing a lightweight solution for fast screening under data-limited conditions, with potential expansion to long-axis data and other cardiac disease subtypes.
2.1.3 Etiological differentiation of cardiac hypertrophy
Following the identification of the hypertrophic phenotype, clinical priority shifts towards precise etiological characterization, which is critical given the distinct therapeutic strategies required for different pathologies. However, differentiating between etiologies with substantial phenotypic overlap—such as HCM, HHD, and cardiac amyloidosis (CA)—remains a diagnostic challenge. Conventional visual assessment and standard quantitative metrics often lack the sensitivity to detect subtle morphological differences. Consequently, this section focuses on the application of AI in the fine-grained differential diagnosis of cardiac hypertrophy with similar macroscopic presentations.
Jiang et al. systematically applied texture analysis combined with machine learning in a single-center study of 251 patients [14]. They extracted 275 radiomics features from four-chamber view images rather than traditional short-axis frames, achieving objective differentiation between CA and HCM. Among various machine learning models, SVM achieved the highest validation accuracy of 85.2%. Gray-level non-uniformity was identified as the most discriminative single feature, reflecting greater microstructural heterogeneity in HCM myocardium due to myocyte disarray and fibrosis.
Liu et al. expanded this approach, not only extracting features from the myocardium but also, for the first time, systematically introducing 3D radiomics features of papillary muscles, to improve left ventricular hypertrophy (LVH) detection and HCM versus HHD differentiation [15]. The study enrolled 345 subjects, and 2,632 original features were extracted, selecting the six most discriminative features. For LVH detection, myocardial (MYO) features alone achieved an AUC of 0.966 with 90.4% accuracy. For HCM versus HHD differentiation, the MYO combined with papillary muscle features (MYO+PM) achieved an AUC of 0.935 (87.0% accuracy, 85% specificity), significantly superior to MYO alone (AUC=0.875) and models based solely on CMR parameters. This study demonstrated that papillary muscle morphology differs between etiologies, with concentric hypertrophy in HCM and pressure-driven hypertrophy in HHD, and that these differences are captured by shape-based radiomics features.
Chuah et al. first introduced the use of a personalized 3D+temporal LV model together with traditional ML for phenotypic analysis between HHD and HCM [16]. Based on 44 subjects, dynamic LV models were created, extracting multiparametric features including wall thickness, strain, and systolic synchrony. Statistical classification identified the most discriminating features, such as maximum end-diastolic wall thickness, longitudinal strain, and mass-to-volume ratio. SVM achieved 77% classification accuracy, improving to 94% after excluding subgroups with phenotypic overlap.
Similarly, Eckstein et al. utilized myocardial strain parameters from both atria and the right ventricle for differentiating CA, HCM, and healthy controls [17]. An SVM model achieved 90.9% accuracy and an AUC of 0.996, underscoring the diagnostic value of myocardial biomechanical features in etiological differentiation.
In deep learning applications, Diao et al. proposed a fully automated framework for segmentation and multietiology classification in 302 LVH patients [18]. Three classification models were tested: (1) Model 1 with 2D patches, (2) Model 2 with ROI-based input, and (3) Model 3 with binary myocardium masks. Model 3 performed the best and most stable, with a three-class accuracy of 77.4% in the external validation. Notably, simple binary masks performed better than raw images for generalization, suggesting that structural representations of inputs may enhance model robustness under limited data conditions.
Chen et al. focused on distinguishing HCM from Fabry cardiomyopathy, an important clinical challenge [19]. Using 215 datasets, they trained a 3D ResNet18 model on short-axis Cine images. Internal testing yielded an AUC of 91.4%, with external validation across different hospitals achieving an AUC of 0.918, indicating strong generalizability.
In a cohort of 119 CA patients and 122 LVH patients of other causes, Germain et al. employed a dual-channel VGG16 model to distinguish CA from other LVH etiologies [20]. The model analyzed diastolic and systolic cine images, significantly outperforming three experienced imaging physicians at both frame-level (AUC: 0.824 vs. 0.630) and patient-level (AUC: 0.895 vs. 0.727) classification.
Beyond differentiating common morphological diseases, deep learning based on Cine-MRI can further reveal genotype-related information. Zhou et al. pioneered the use of four-chamber view cine sequences to predict genetic mutation status in HCM patients [21]. They combined InceptionResNetV2 for image feature extraction with long short-term memory (LSTM) networks for temporal dynamics analysis, achieving an AUC of 0.80, superior to traditional clinical scoring systems. This work suggests that subtle myocardial structural and motion patterns embedded in Cine-MRI may correlate with underlying genetic defects, providing a new perspective for non-invasive genetic risk stratification. Summaries of representative studies are presented in Table 1.

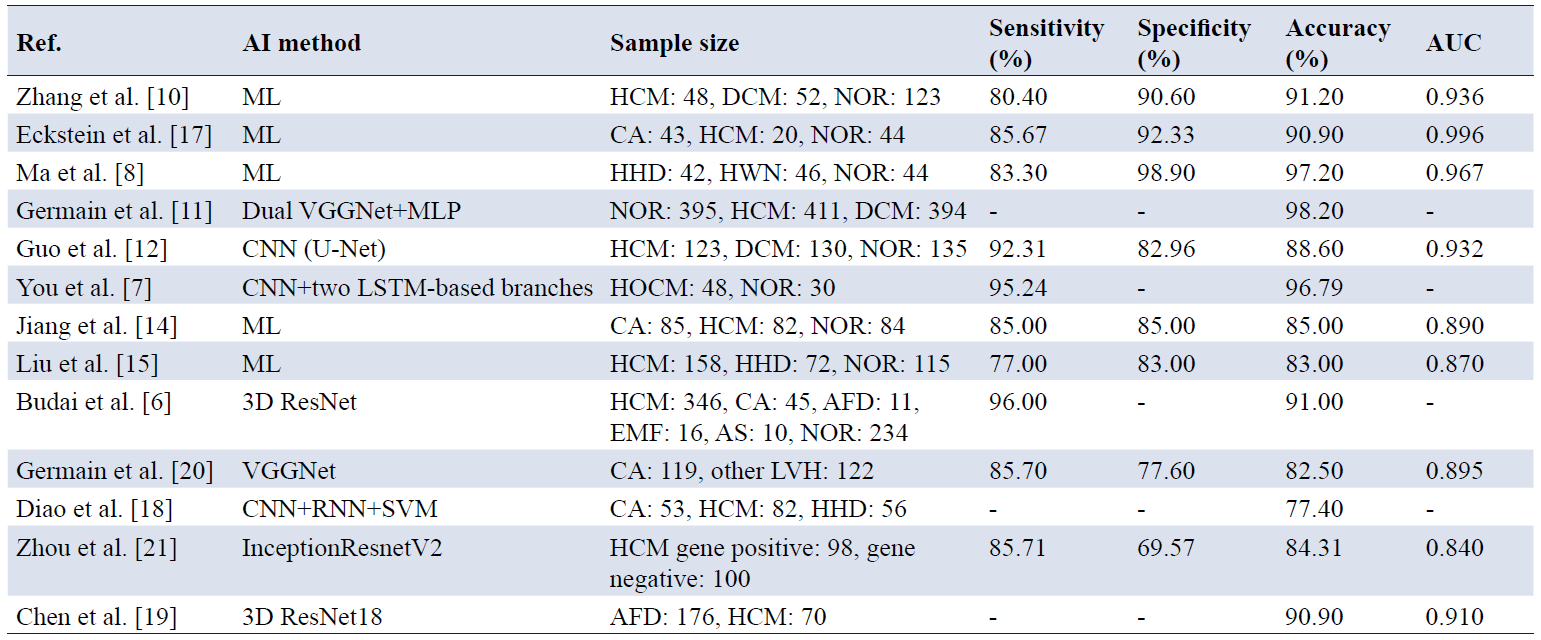
Note: AFD, Anderson–Fabry disease; AS, Aortic Stenosis; AUC, area under the curve; CA, cardiac amyloidosis; CNN, convolutional neural networks; DL, deep learning; DCM, dilated cardiomyopathy; EMF, endomyocardial fibrosis; HHD, hypertensive heart disease; HCM, hypertrophic cardiomyopathy; HOCM, hypertrophic obstructive cardiomyopathy; LVH, left-ventricular hypertrophy; ML, machine learning; NOR, normal person.
2.2 AI diagnosis of cardiac hypertrophy based on T1/T2 mapping sequences
T1 and T2 mapping are standardized CMR quantitative tissue characterization sequences that reflect microscopic changes in the myocardial extracellular matrix and water content. Compared with conventional morphological indicators, these sequences provide earlier and more sensitive pathological information [22]. T1/T2 mapping can detect subclinical lesions, such as diffuse fibrosis and edema in a contrast-free or low-dose contrast environments, making them excellent candidates for AI diagnosis: quantitative parameters are objective and reproducible, while texture analysis of parameters can further explore tissue heterogeneity at microscopic level. In recent years, the application of deep learning and radiomics to T1/T2 mapping have demonstrated improved accuracy in the differential diagnosis of cardiac hypertrophy of varying etiologies [23].
To address multi-etiology differentiation in cardiac hypertrophy, Antonopoulos et al. proposed a machine learning classification framework based on T1 mapping radiomics [24]. 850 radiomics features were extracted from 149 subjects. Following feature stability assessment and removal of highly correlated features, a total of 84 features were selected for multinomial logistic regression modeling using a random forest algorithm for feature importance ranking. The model achieved a multi-class AUC of 0.753 in distinguishing normal, LVH, HCM, and CA, with performance notably superior to the traditional native T1 mean values across all categories. Similarly, Shi et al. performed a systematic comparison, simultaneously assessing the discriminative power of T1 and extracellular volume (ECV) mapping texture analysis for differentiating HCM, HHD, and healthy controls, compared to functional strain parameters [25]. In a cohort of 145 patients, 271 texture features were extracted from T1 and ECV maps. ECV texture analysis achieved better diagnostic performance (AUC 0.894) compared to T1 texture for distinguishing between HCM and HHD, while performance was similar for patients versus healthy controls. These findings indicate that standardized ECV characteristics provide advantages in etiological differentiation.
Traditional T2-weighted imaging is often used to detect myocardial edema, but interpretation is subjective. Huang et al. applied texture analysis to T2-weighted CMR for differentiating CA from HCM [26]. In 317 patients, a total of 837 texture features were extracted from short-axis T2 STIR sequence, with 7 optimal features selected, achieving an AUC of 0.842; accuracy dropped to 79.2% on an independent test set of 90 patients. Notably, the texture model did not differ significantly from quantitative LGE in its performance for diagnosis, suggesting that contrast-free T2 texture analysis could serve an alternative to LGE, especially in CA patients with compromised renal function.
Beyond diagnostic value, AI-derived parameters from mapping sequences have demonstrated significant prognostic potential. Hwang et al. used Myomics-Q deep learning algorithm for fully automated native T1 and ECV measurements, where they found that ECV effectively differentiated CA from other LVH etiology (AUC=0.946) and provided prognostic prediction for AL-CA patients [27]. The study identified ECV≥40% as an independent risk factor for the composite endpoint of cardiovascular death or heart failure hospitalization in AL-CA patients. Integrating automated ECV into the updated Mayo staging system greatly enhanced patient risk classification, with Integrated Discrimination Improvement (IDI) increasing by 27.9% and Net Reclassification Index (NRI) increasing by 13.8%.
2.3 AI diagnosis of cardiac hypertrophy based on LGE sequences
LGE imaging is the standard CMR technique for myocardial tissue characterization. By visualizing the retention patterns of gadolinium-based contrast agents in the myocardial interstitium, LGE can intuitively reflect the distribution of myocardial pathological remodeling, making it an important tool for distinguishing etiologies of cardiac hypertrophy [28]. However, traditional visual assessment is limited by the experience of observers, variability in the scanning parameters, and it is difficult to detect lesions in the early stage. In recent years, AI technologies have enabled automatic identification of pathological patterns from LGE images, providing more objective judgments and improving early detection rates.
Martini et al. developed a CNN model for the end-to-end analysis of LGE images in 206 patients with suspected CA, using raw short-axis, two-chamber, and four-chamber LGE views [29]. The model achieved a high AUC of 0.982 in the test set. This study showed that deep learning models could automatically capture complex image patterns of CA, including myocardial enhancement, early darkening of the blood pool, and even extracardiac features such as pericardial fluid, with results comparable to those of expert radiologists, but with higher efficiency. Notably, the deep learning model did not significantly outperform CMR features-based machine learning models, indicating that in the case of limited data, the superiority of end-to-end deep learning over feature engineering may have been exaggerated.
To address the limited information extracted from single-sequence LGE, Zhou et al. employed high-throughput radiomics to analyze LGE images of 200 biopsy-confirmed AL-type amyloidosis patients [30]. A total of 1,906 features representing texture, shape, and signal intensity distribution were extracted. An XGBoost-based diagnostic model demonstrated excellent performance in both internal and external multicenter validation. The radiomics model of the LV basal segments achieved the highest external validation AUC of 0.92, significantly superior to traditional visual assessment (AUC=0.75). More importantly, the radiomics score moderately correlated with CA disease severity, suggesting that LGE-based radiomics features can be used not only for diagnosis but also for assessing disease burden and prognosis.
AI-based LGE diagnostic methods have demonstrated good diagnostic performance in specific myocardial diseases, especially amyloidosis. However, comparisons of AI paradigms with similar diagnostic performance but different approaches indicate that, on small-scale datasets, the absolute advantage of deep learning over carefully designed feature-based models may be limited. To advance AI applications of LGE imaging in the differential diagnosis of cardiac hypertrophy, larger-scale multicenter annotated databases, multi-sequence data fusion strategies, and rigorous external validation are required, alongside evaluation of clinical implementability.
2.4 AI diagnosis of cardiac hypertrophy based on multi-sequence CMR fusion
Single-sequence image analysis often fails to fully characterize the essential features of cardiac hypertrophy, as different CMR sequences provide complementary pathological information. Cine-MRI captures dynamic cardiac function and morphological changes, LGE sequences display spatial distribution of fibrosis, and T1/T2 mapping provides quantitative tissue characterization. Multi-sequence CMR data fusion integrates complementary information from different sequences (e.g., cine imaging, LGE, and strain analysis) to construct more discriminative feature sets, thereby achieving more precise diagnostic classification and risk assessment of myocardial diseases.
Zhang et al. extracted 1,409 radiomics features from Cine and LGE sequences in 621 patients [31]. After rigorous feature screening and multivariate logistic regression optimization, 40 optimal features were selected to establish a combined model, achieving AUCs of 0.979 and 0.981 in the training and validation cohorts, respectively, with sensitivities of 95.2% and 86.3%. This demonstrates that fusion of deep image information beyond human visual discrimination can greatly improve model diagnostic accuracy, highlighting the potential of high-precision diagnostic assistance systems.
Kong et al. employed principal component analysis (PCA) to project highly correlated parameters such as left ventricular ejection fraction (LVEF), left ventricular end-systolic volume index (LVESVI), left ventricular end-diastolic volume index (LVEDVI), maximum left ventricular wall thickness (MLVWT), and global circumferential strain into an orthogonal principal component space, developing an Integrated Algorithm (IntA) [32]. In Phase I (148 patients: 75 HCM, 33 HHD, 40 controls), IntA achieved an AUC of 0.900 (83% sensitivity, 91% specificity) in LGE-positive patients and an AUC of 0.947 (100% sensitivity, 82% specificity) in LGE-negative patients. Phase II external validation of 71 patients maintained good performance (LGE-positive AUC of 0.857, LGE-negative AUC of 0.846), demonstrating robust generalization. PCA effectively addressed multiparameter collinearity through dimensionality reduction without information loss, preserving over 90% of original variance.
With the widespread application of AI in medical image processing, enhanced automated feature extraction and fusion capabilities have enabled high-resolution myocardial phenotype characterization. Lu et al. utilized deep convolutional neural networks (DCNN) for automated CMR segmentation, generating 216 fine-segment LV thickness features [33]. Logistic regression, SVM, and multilayer neural networks were used for adverse event prediction in cardiac sarcoidosis patients. Features obtained from automated processing improved machine learning model accuracy compared with manually delineated features: logistic regression from 0.75 to 0.78, SVM from 0.74 to 0.78, and multilayer perceptron (MLP) from 0.76 to 0.77.
Three-dimensional myocardial deformation analysis (3D-MDA) achieved more refined multi-sequence fusion through cross-modal standardization. Satriano et al. reconstructed 3D dynamic meshes from Cine-MRI multi-planar images using optical flow registration, calculating 917 structural and deformation parameters per American Heart Association (AHA) segment, including peak strain amplitude, strain rate, and diastolic thickness [34]. In a multi-classification study of 163 patients (85 HCM, 30 AFD, 30 HHD, 18 CA), the 3D-MDA neural network model achieved an AUC of 0.94 (92% sensitivity, 90% specificity) in five-fold cross-validation, far superior to traditional threshold-based methods (regional wall thickness alone: AUC=0.75), demonstrating that combined structural and deformation analysis adds diagnostic information.
In deep learning approaches, Weberling et al. enrolled 400 patients from multiple centers and vendors (95 AL amyloidosis, 116 ATTR, 94 HCM, 95 healthy controls) from 56 medical institutions [35]. Employing a three-stage cascaded AutoML framework, the first stage distinguished healthy from patients with an AUC of 1.0; the second stage differentiated HCM from amyloidosis with an AUC of 0.99; and the third stage distinguished AL from ATTR with an AUC of 0.92. Agibetov et al. analyzed LGE, T1-mapping, and Cine sequences in 502 patients using VGG16 transfer learning to diagnose CA [36]. The study systematically compared the performance of three learning strategies across different sequences. LGE achieved the highest AUC of 0.96 with 94% sensitivity and 90% specificity, MOLLI sequence achieved an AUC of 0.93, and Cine sequence only 0.90, although multi-sequence fusion offers complementary value. Paciorek et al. employed DenseNet-161 architecture to develop a binary classification model on 200 patients (137 pathological, 63 healthy controls), comparing diagnostic performance between T1-mapping and LGE PSIR sequences [37]. The PSIR model achieved 88% accuracy and 100% sensitivity (38% specificity), while the T1-mapping model achieved an accuracy of 70%, a sensitivity of 78%, and a specificity of 54%.
With the evolution of deep learning architectures, multi-sequence fusion has progressively improved. Cockrum et al. employed a spatial-temporal Vision Transformer (ViT) model for three-class classification tasks in 807 patients (252 CA, 290 HCM, 265 others), integrating Cine and LGE sequences for differential diagnosis between CA and HCM [38]. The model achieved 84.1% accuracy and 0.954 AUC in the internal test set, maintaining 82.8% accuracy and 0.957 AUC performance in external validation cohorts. Notably, the ViT model maintained 61.1% accuracy on cases with low physician diagnostic confidence or human errors. After exclusion of image quality, the accuracy in this subgroup increased to 79.1%, demonstrating that advanced deep learning models based on multi-sequence fusion hold promise as valuable clinical decision support tools, particularly providing critical assistance in diagnostically challenging cases.
To systematically test the effectiveness of multi-sequence fusion, Wang et al. developed a two-stage diagnostic paradigm in a large-scale study of 9,719 patients (8,066 cardiovascular disease patients with 11 disease categories, 1,653 healthy controls) [39]. The first stage used Cine sequences for abnormality screening, while the second stage integrated Cine and LGE for specific disease classification. Multi-sequence fusion improved performance over single modality: class-weighted AUC increased by 1.9% and F1 score by 6.8% compared to short-axis Cine.
In cardiac amyloidosis subtype differentiation, Germain et al. applied VGG16 models to classify Cine and LGE images of 120 patients (70 AL, 50 ATTR) [40]. Cine-based model achieved 75.0% accuracy and AUC 0.839, outperforming LGE-based models (accuracy =61.1%, AUC=0.679) and CNN models (accuracy =84.5%, AUC=0.752), exceeding performance of three experienced physicians. Summaries of representative studies are provided in Table 2.
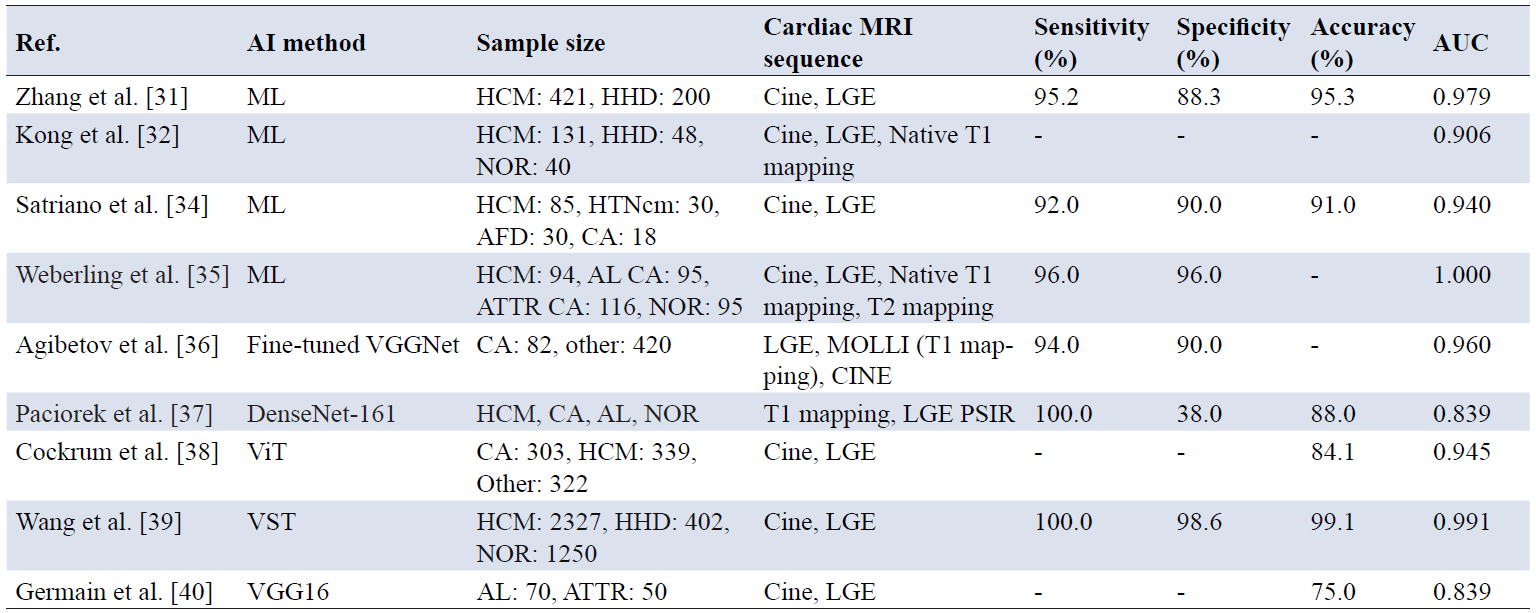
Note: AFD, Anderson–Fabry disease; AL, light chains; ATTR, transthyretin; AUC, area under the curve; CA, cardiac amyloidosis; CNN, convolutional neural networks; DL, deep learning; DCM, dilated cardiomyopathy; EMF, endomyocardial fibrosis; HCM, hypertrophic cardiomyopathy; HHD, hypertensive heart disease; HTNcm, hypertensive cardiomyopathy; LVH, left-ventricular hypertrophy; ML, machine learning; NOR, normal person; ViT, Vision Transformer; VST, Video Swin Transformer.
CMR reports represent the final textual output of clinical diagnostic decision-making, integrating expert interpretations of imaging findings with key quantitative measurements. The application of Natural Language Processing (NLP) techniques to automatically extract structured information from these unstructured text reports provides an efficient pathway for large-scale case screening, phenotypic classification, and clinical research.
Dewaswala et al. conducted pioneering work to develop an NLP system capable of automatically and precisely extracting HCM diagnoses along with phenotypic features from free-text CMR reports [41]. The study used a rule-based two-tier NLP method. In the first tier, the determined whether a report contained an HCM diagnosis. In the second tier, 9 key categorical concepts and 5 numerical concepts were extracted from the diagnosis-positive reports. Using a dataset of 391 CMR reports, the system demonstrated excellent performance, achieving an accuracy of 0.99 in extracting HCM diagnosis (sensitivity of 0.98 and specificity of 1.00). For phenotypic feature extraction, most categorical concepts achieved accuracies between 0.92 and 0.99, while numerical variables (such as LVEF and LV mass) achieved even higher accuracies of 0.96 to 0.99.
Sundaram et al. further explored a machine learning approach for automatically detecting HCM using CMR reports [42]. In their study, NLP techniques were applied to extract features from the “Impression” section of CMR reports and train an interpretable machine learning model to classify patients as “HCM-Yes”, “HCM-No”, or “HCM-Possible”. Researchers first applied unsupervised NLP to extract high-frequency co-occurring noun-adjective phrases from the text as candidate features, followed by training and predicting with random forest classifiers. In a data set with 1,835 reports, the resulting models achieved an overall classification accuracy of approximately 85%.
To conclude, AI-assisted diagnostic research based on CMR reports demonstrates that NLP and ML can accurately identify cardiac hypertrophy from unstructured report text, particularly in the automatic detection and phenotypic stratification of HCM. However, text-based models remain constrained by variability in report-writing styles and potential class imbalance within datasets, with limited capability for subtle differentiation between HCM and other hypertrophy types. Future work should consider integrating report-level NLP with multi-sequence imaging data to establish unified AI diagnostic system that combine textual and imaging information, thereby improving model generalizability and facilitating clinical translation.
This review systemically summarizes recent advances in the application of AI in diagnosing cardiac hypertrophy based on CMR imaging. It provides a comprehensive overview of AI diagnostic methods utilizing Cine-MRI sequences, T1/T2 mapping sequences, LGE sequences, and various multi-sequence fusion strategies. In addition, the technological development from traditional machine learning to deep learning is discussed, along with their applications in distinguishing normal from hypertrophic hearts and in the etiological classification of cardiac hypertrophy. Furthermore, this review highlights the emerging role of NLP-based automatic parsing of CMR reports in facilitating large-scale case identification and phenotypic stratification.
Despite these advances, several challenges remain. Data quality and annotation problems are major constraints to AI model performance. Most current studies are based on single-center datasets with relatively small sample sizes and potential class imbalances, thereby limiting generalizability of the developed models. Additionally, further development of AI technology still requires richer data support, including fusion of multimodal data and integration of clinical data. Combining information from genomics, proteomics, and other fields may enable a more comprehensive understanding of underlying mechanisms of cardiac hypertrophy, thereby enhancing the diagnostic and predictive accuracy of AI models. Moreover, with the further development of AI-based intelligent diagnostic technology, how to realize multi-center data sharing and model cooperation under the premise of protecting patients’ privacy is also an important problem for the promotion of AI clinical application.
Looking forward, the application of AI in CMR-based diagnostic assistance for cardiac hypertrophy is promising. With the continuous evolution of deep learning algorithms and increasing computational capacity, AI models are expected to achieve higher levels of diagnostic accuracy and predictive capability. Strengthened interdisciplinary collaboration among medical imaging specialists, AI researchers and clinicians will be essential to guarantee that technological developments effectively address real clinical needs. With ongoing development in technology and accelerating clinical implementation of AI, these approaches are expected to play an increasingly important role in the precision diagnosis and individualized management of cardiac hypertrophy, thereby improving patient outcomes and quality of life.
Author contributions
Shimin Zhou was responsible for the conception, drafting, revision, and summarization of the entire manuscript. Xudong Guo, Yunli Shen, Qinfen Jiang, Xin Gong, Jie Ding, Yihong Yang were in charge of the conception and revision of the manuscript, providing guiding support, and notifying the status of the manuscript. Guojie Xu was tasked with the acquisition, analysis, and integration of literature pertaining to AI diagnosis based on Cine-MRI sequence. Jican Wen was responsible for the acquisition, analysis, and integration of literature related to AI diagnosis based on T1/T2 Mapping and LGE sequences. Jingyang Niu was in charge of the acquisition, analysis, and integration of literature concerning AI diagnosis based on multi-sequence CMR data fusion and NLP-based report analysis.
Funding
This work is supported by Open Project Fund of State Key Laboratory of Cardiovascular Diseases (2024SKL-TJ012).
Data availability
Not applicable.
Ethics approval and consent to participate
Not applicable.
Consent for publication
Not applicable.
Competing interests
The authors declare that they have no competing interests.
Acknowledgements
Not applicable.
[1] Tore D, Faletti R, Gaetani C, Bozzo E, Biondo A, Carisio A, et al. Cardiac magnetic resonance of hypertrophic heart phenotype: A review. Heliyon. 2023 Jun;9(6):e17336. https://doi.org/10.1016/j.heliyon.2023.e17336
[2] Cirillo C, Matarrese MAG, Monda E, Pagnano ME, Vitale J, Verrillo F, et al. Artificial intelligence for left ventricular hypertrophy detection and differentiation on echocardiography, Int J Cardiol. 2025 Mar 1;422:132979. https://doi.org/10.1016/j.ijcard.2025.132979
[3] Baggiano A, Del Torto A, Guglielmo M, Muscogiuri G, Fusini L, Babbaro M, et al. Role of CMR mapping techniques in cardiac hypertrophic phenotype. Diagnostics (Basel). 2020 Sep 29;10(10):770. https://doi.org/10.3390/diagnostics10100770
[4] Lin A, Kolossvary M, Isgum I, Maurovich-Horvat P, Slomka PJ, Dey D. Artificial intelligence: Improving the efficiency of cardiovascular imaging. Expert Rev Med Devices. 2020 Jun;17(6):565-577. https://doi.org/10.1080/17434440.2020.1777855
[5] Cau R, Pisu F, Suri JS, Montisci R, Gatti M, Mannelli L, et al. Artificial intelligence in the differential diagnosis of cardiomyopathy phenotypes. Diagnostics (Basel). 2024 Jan 10;14(2):156. https://doi.org/10.3390/diagnostics14020156
[6] Budai A, Suhai FI, Csorba K, Dohy Z, Szabo L, Merkely B, et al. Automated classification of left ventricular hypertrophy on cardiac MRI. Appl Sci. 2022 Apr 20;12(9):4151. https://doi.org/10.3390/app12094151
[7] You Y, Viktorovich LA, Qiu J, Nikolaevich KA, Vladimirovich BY. Cardiac magnetic resonance image diagnosis of hypertrophic obstructive cardiomyopathy based on a double-branch neural network. Comput Methods Programs Biomed. 2021 Mar;200:105889. https://doi.org/10.1016/j.cmpb.2020.105889
[8] Ma ZP, Wang SW, Xue LY, Zhang XD, Zheng W, Zhao YX, et al. A study on the application of radiomics based on cardiac MR non-enhanced cine sequence in the early diagnosis of hypertensive heart disease. BMC Med Imaging. 2024 May 27;24(1):124. https://doi.org/10.1186/s12880-024-01301-9
[9] Abramikas Z, Jasiukevicite I, Balciunaite G, Glaveckait S, Palionis D, Valeviciene N. Artificial intelligence performance in cardiac magnetic resonance strain analysis for aortic stenosis: Validation with echocardiography and healthy controls. Medicina (Kaunas). 2025 May 22;61(6):950. https://doi.org/10.3390/medicina61060950
[10] Zhang X, Cui C, Zhao S, Xie L, Tian Y. Cardiac magnetic resonance radiomics for disease classification. Eur Radiol. 2023 Apr;33(4):2312-2323. https://doi.org/10.1007/s00330-022-09236-x
[11] Germain P, Vardazaryan A, Padoy N, Labani A, Roy C, Schindler TH, et al. Classification of cardiomyopathy from MR cine images using convolutional neural network with transfer learning. Diagnostics (Basel). 2021 Aug 27;11(9):1554. https://doi.org/10.3390/diagnostics11091554
[12] Guo J, Lu H, Chen Y, Zeng M, Jin H. Artificial intelligence study on left ventricular function among normal individuals, hypertrophic cardiomyopathy and dilated cardiomyopathy patients using 1.5T cardiac cine MR images obtained by SSFP sequence. Br J Radiol. 2022 May 1;95(1133):20201060. https://doi.org/10.1259/bjr.20201060
[13] Wibowo A, Triadyaksa P, Sugiharto A, Sarwoko EA, Nugroho FA, Arai H, et al. Cardiac disease classification using two-dimensional thickness and few-shot learning based on magnetic resonance imaging image segmentation. J Imaging. 2022 Jul 11;8(7):194. https://doi.org/10.3390/jimaging8070194
[14] Jiang S, Zhang L, Wang J, Li X, Hu S, Fu Y, et al. Differentiating between cardiac amyloidosis and hypertrophic cardiomyopathy on non-contrast cine-magnetic resonance images using machine learning-based radiomics. Front Cardiovasc Med. 2022 Oct 26;9:1001269. https://doi.org/10.3389/fcvm.2022.1001269
[15] Liu Q, Lu Q, Chai Y, Tao Z, Wu Q, Jiang M, et al. Papillary-muscle-derived radiomic features for hypertrophic cardiomyopathy versus hypertensive heart disease classification. Diagnostics (Basel). 2023 Apr 25;13(9):1544. https://doi.org/10.3390/diagnostics13091544
[16] Chuah SH, Md Sari NA, Chew BT, Tan LK, Chiam YK, Chan BT, et al. Phenotyping of hypertensive heart disease and hypertrophic cardiomyopathy using personalized 3D modelling and cardiac cine MRI. Phys Med. 2020 Oct;78:137-149. https://doi.org/10.1016/j.ejmp.2020.08.022
[17] Eckstein J, Moghadasi N, Korperich H, Weise Valdés E, Sciacca V, Paluszkiewicz L, et al. A machine learning challenge: Detection of cardiac amyloidosis based on bi-atrial and right ventricular strain and cardiac function. Diagnostics (Basel). 2022 Nov 4;12(11):2693. https://doi.org/10.3390/diagnostics12112693
[18] Diao K, Liang HQ, Yin HK, Yuan MJ, Gu M, Yu PX, et al. Multichannel deep learning model-based myocardial spatial-temporal morphology feature on cardiac MRI cine images diagnoses the cause of LVH. Insights Imaging. 2023 Apr 24;14(1):70. https://doi.org/10.1186/s13244-023-01401-0
[19] Chen WW, Kuo L, Lin YX, Yu WC, Tseng CC, Lin YJ, et al. A deep learning approach to classify fabry cardiomyopathy from hypertrophic cardiomyopathy using cine imaging on cardiac magnetic resonance. Int J Biomed Imaging. 2024 Apr 26;2024:6114826. https://doi.org/10.1155/2024/6114826
[20] Germain P, Vardazaryan A, Padoy N, Labani A, Roy C, Schindler TH, et al. Deep learning supplants visual analysis by experienced operators for the diagnosis of cardiac amyloidosis by cine-CMR. Diagnostics (Basel). 2021 Dec 29;12(1):69. https://doi.org/10.3390/diagnostics12010069
[21] Zhou H, Li L, Liu Z, Zhao K, Chen X, Lu M, et al. Deep learning algorithm to improve hypertrophic cardiomyopathy mutation prediction using cardiac cine images. Eur Radiol. 2021 Jun;31(6):3931-3940. https://doi.org/10.1007/s00330-020-07454-9
[22] Ferreira VM, Piechnik SK. CMR parametric mapping as a tool for myocardial tissue characterization. Korean Circ J. 2020 Aug;50(8):658-676. https://doi.org/10.4070/kcj.2020.0157
[23] Muser D, Chahal AA, Selvanayagam JB, Nucifora G. Clinical applications of cardiac magnetic resonance parametric mapping. Diagnostics (Basel). 2024 Aug 20;14(16):1816. https://doi.org/10.3390/diagnostics14161816
[24] Antonopoulos AS, Boutsikou M, Simantiris S, Angelopoulos A, Lazaros G, Panagiotopoulos I, et al. Machine learning of native T1 mapping radiomics for classification of hypertrophic cardiomyopathy phenotypes. Sci Rep. 2021 Dec 8;11(1):23596. https://doi.org/10.1038/s41598-021-02971-z
[25] Shi RY, Wu R, An DL, Chen BH, Wu CW, Du L, et al. Texture analysis applied in T1 maps and extracellular volume obtained using cardiac MRI in the diagnosis of hypertrophic cardiomyopathy and hypertensive heart disease compared with normal controls. Clin Radiol. 2021 Mar;76(3):236.e239-236.e219. https://doi.org/10.1016/j.crad.2020.11.001
[26] Huang S, Shi K, Zhang Y, Yan WF, Guo YK, Li Y, et al. Texture analysis of T2-weighted cardiovascular magnetic resonance imaging to discriminate between cardiac amyloidosis and hypertrophic cardiomyopathy. BMC Cardiovasc Disord. 2022 May 21;22(1):235. https://doi.org/10.1186/s12872-022-02671-0
[27] Hwang IC, Chun EJ, Kim PK, Kim M, Park J, Choi HM, et al. Automated extracellular volume fraction measurement for diagnosis and prognostication in patients with light-chain cardiac amyloidosis. PLoS One. 2025 Jan 22;20(1):e0317741. https://doi.org/10.1371/journal.pone.0317741
[28] Burrage MK, Ferreira VM. Cardiovascular magnetic resonance for the differentiation of left ventricular hypertrophy. Curr Heart Fail Rep. 2020 Oct;17(5):192-204. https://doi.org/10.1007/s11897-020-00481-z
[29] Martini N, Aimo A, Barison A, Della Latta D, Vergaro G, Aquaro GD, et al. Deep learning to diagnose cardiac amyloidosis from cardiovascular magnetic resonance. J Cardiovasc Magn Reson. 2020 Dec 7;22(1):84. https://doi.org/10.1186/s12968-020-00690-4
[30] Zhou XY, Tang CX, Guo YK, Tao XW, Chen WC, Guo JZ, et al. Diagnosis of cardiac amyloidosis using a radiomics approach applied to late gadolinium-enhanced cardiac magnetic resonance images: A retrospective, multiochort, diagnostic study. Front Cardiovasc Med. 2022 Mar 30;9:818957. https://doi.org/10.3389/fcvm.2022.818957
[31] Zhang H, Tian J, Zhang C, Wang H, Hui K, Wang T, et al. Discrimination models with radiomics features derived from cardiovascular magnetic resonance images for distinguishing hypertensive heart disease from hypertrophic cardiomyopathy. Cardiovasc Diagn Ther. 2024 Feb 15;14(1):129-142. https://doi.org/10.21037/cdt-23-350
[32] Kong LC, Wu LM, Wang Z, Liu C, He B. An integrated algorithm for differentiating hypertrophic cardiomyopathy from hypertensive heart disease. J Magn Reson Imaging. 2023 Oct;58(4):1084-1097. https://doi.org/10.1002/jmri.28580
[33] Lu C, Wang YG, Zaman F, Wu X, Adhaduk M, Chang A, et al. Predicting adverse cardiac events in sarcoidosis: Deep learning from automated characterization of regional myocardial remodeling. Int J Cardiovasc Imaging. 2022 Aug;38(8):1825-1836. https://doi.org/10.1007/s10554-022-02564-5
[34] Satriano A, Afzal Y, Sarim Afzal M, Fatehi Hassanabad A, Wu C, Dykstra S, et al. Neural-network-based diagnosis using 3-dimensional myocardial architecture and deformation: Demonstration for the differentiation of hypertrophic cardiomyopathy. Front Cardiovasc Med. 2020 Nov 11;7:584727. https://doi.org/10.3389/fcvm.2020.584727
[35] Weberling LD, Ochs A, Benovoy M, Aus dem Siepen F, Salatzki J, Giannitsis E, et al. Machine learning to automatically differentiate hypertrophic cardiomyopathy, cardiac light chain, and cardiac transthyretin amyloidosis: A multicenter CMR study. Circ Cardiovasc Imaging. 2025 Jul;18(7):e017761. https://doi.org/10.1161/circimaging.124.017761
[36] Agibetov A, Kammerlander A, Duca F, Nitsche C, Koschutnik M, Donà C, et al. Convolutional neural networks for fully automated diagnosis of cardiac amyloidosis by cardiac magnetic resonance imaging. J Pers Med. 2021 Dec 1;11(12):1268. https://doi.org/10.3390/jpm11121268
[37] Paciorek AM, von Schacky CE, Foreman SC, Gassert FG, Gassert FT, Kirschke JS, et al. Automated assessment of cardiac pathologies on cardiac MRI using T1-mapping and late gadolinium phase sensitive inversion recovery sequences with deep learning. BMC Med Imaging. 2024 Feb 13;24(1):43. https://doi.org/10.1186/s12880-024-01217-4
[38] Cockrum J, Nakashima M, Ammoury C, Rizkallah D, Mauch J, Lopez D, et al. Leveraging a vision transformer model to improve diagnostic accuracy of cardiac amyloidosis with cardiac magnetic resonance. JACC Cardiovasc Imaging. 2025 Mar;18(3):278-290. https://doi.org/10.1016/j.jcmg.2024.09.010
[39] Wang YJ, Yang K, Wen Y, Wang P, Hu Y, Lai Y, et al. Screening and diagnosis of cardiovascular disease using artificial intelligence-enabled cardiac magnetic resonance imaging. Nat Med. 2024 May;30(5):1471-1480. https://doi.org/10.1038/s41591-024-02971-2
[40] Germain P, Vardazaryan A, Labani A, Padoy N, Roy C, El Ghannudi S. Deep learning to classify AL versus ATTR cardiac amyloidosis MR images. Biomedicines. 2023 Jan 12;11(1):193. https://doi.org/10.3390/biomedicines11010193
[41] Dewaswala N, Chen D, Bhopalwala H, Kaggal VC, Murphy SP, Bos JM, et al. Natural language processing for identification of hypertrophic cardiomyopathy patients from cardiac magnetic resonance reports. BMC Med Inform Decis Mak. 2022 Oct 18;22(1):272. https://doi.org/10.1186/s12911-022-02017-
[42] Sundaram DSB, Arunachalam SP, Damani DN, Farahani NZ, Enayati M, Pasupathy KS, et al. Natural language processing based machine learning model using cardiac MRI reports to identify hypertrophic cardiomyopathy patients. Proc Des Med Devices Conf. 2021 Apr;2021:V001T03A005. https://doi.org/10.1115/dmd2021-1076
ISSN: 2957-5478
Volume 4, Issue 1
March 2026
Pages: 1-76


 Log In

 On This Page
 CITE
CITE